Airbnb Market Insights, British Columbia
One of the biggest issues for Airbnb hosts is their lack of access to critical market data, like average daily rates, occupancy rates, and total room counts. These Airbnb market insights give hosts the opportunity to improve, optimize and advance their business practices and pricing efficiency. Without this information, hosts are left almost completely in the dark on how to improve their pricing, as dictated by real data. This real data includes competitor analysis, industry benchmarking, exchange rates, overall market health, and more.
Having a more in-depth understanding of your surrounding market can give you an edge over your competitors. It really is that simple. Not only can you beat them with optimized pricing, but you can also identify market trends and improve your offering to take better advantage of them before your competitors even realize what they’re missing.
Let’s take the digital nomad trend, for example. Hosts that were better informed of shifts in the market could easily identify that longer stays were becoming increasingly popular. They then tweaked their pricing to make sure that they capitalized on this global trend and benefited from it financially. These hosts will have raised their minimum stay requirements (to ensure the dates were not taken by shorter bookings), and some even offered long-term discounts to encourage guests to book an extra week or so. These discounts usually offered guests 10% off if they stayed for longer than four consecutive weeks.
In light of this, we wanted to offer Lifty Life readers some key market data for British Columbia, along with some knowledgeable analysis. The Airbnb market insights are divided into three categories: average occupancy rate, average daily rate, and total room count within the specific markets. The data averages were calculated from Airbnb data collected in April 2021 by DPGO, a dynamic pricing tool that offers extensive Airbnb market insights and optimized pricing for every type of Airbnb property and portfolio.
Airbnb Market Insights – British Columbia, Canada
Occupancy Rate
Below are two graphs, the 10 cities within British Columbia with the highest occupancy rates for April 2021, and the occupancy rates of the top 10 largest cities, sorted by population size.


As you might have noticed from the graphs, the cities with the highest occupancy rates may not be what you expected. Of course, these figures are relative to the total number of properties available in those specific markets. One noticeable omission from both lists is the city of Whistler. This is due to the surge in COVID-19 cases at the end of March 2021 and the fact that the city closes all ski lifts, restaurants, and other social spaces. The Guardian reported that The Whistler Blackcomb ski resort was closed by provincial authorities at the end of March in an attempt to control the outbreak of the Brazilian P1 COVID mutation. Naturally, this closure knocked Whistler out of the top 10 for occupancy rate.
Generally speaking, occupancy rates are a great way to show both the success of an Airbnb listing and that of the market. This, amongst other Airbnb market insights, is one of the metrics that you can access for free via Markets by DPGO. Simply enter your target area name or postcode and you’ll be shown a range of insights, specific to your market, for free!
Average Daily Rate
Below are two graphs, the 10 cities within British Columbia with the highest average daily rates in April 2021, and the average daily rates of the top 10 largest cities, sorted by population size.


Examining a market’s Average Daily Rate (ADR) is a really important indicator for market health. Not only does it give hosts a snapshot of what the majority of their fellow hosts in the area are charging, but it can also highlight if your prices are too high or too low.
By using ADR, hosts can optimize their pricing and give themselves a competitive advantage. These ADR figures do not take property type into account. They simply take all of the daily rates in the market during any given period and average them out. To truly optimize your pricing, you’ll need to compare your prices to that of similar local listings and benchmark from there. You can access these sorts of insights via DPGO.
Total Room Count
Below are two graphs, the 10 cities within British Columbia with the highest total room counts in April 2021, and the total room counts of the top 10 largest cities, sorted by population size.

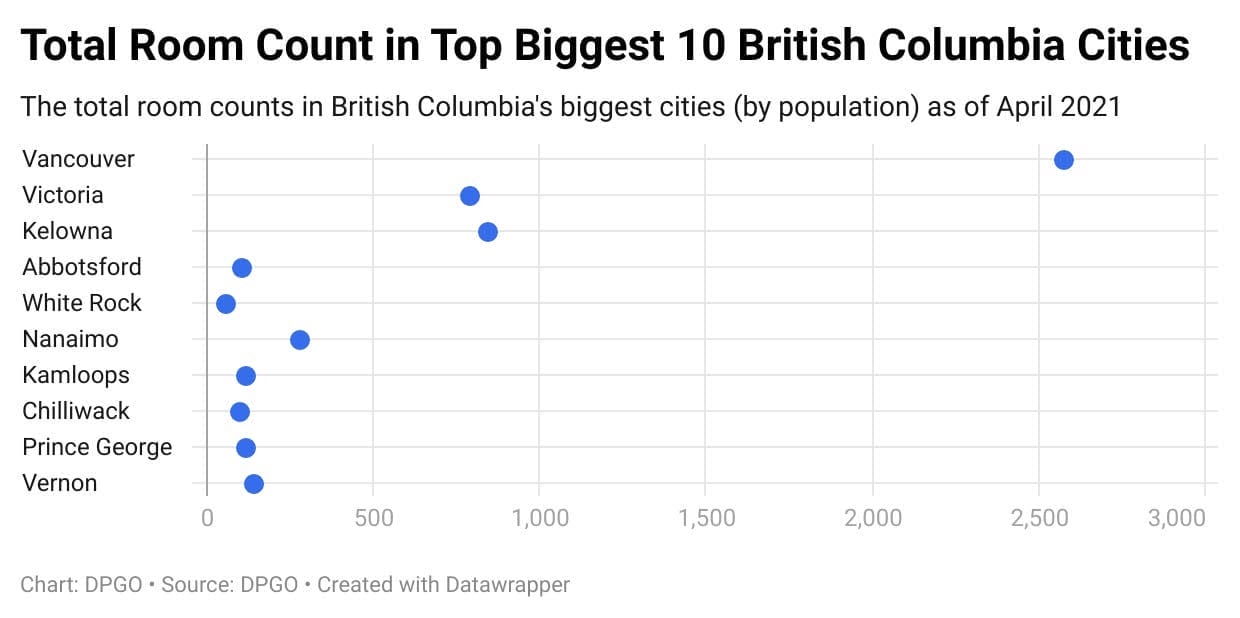
Total Room Count gives hosts a window into the financial wellbeing of the market. If the total room count is low, it usually means that demand is low. This can be due to a few reasons. Either the market is in low season, and hosts have pulled their listings off the market, or the demand for that area is just generally quite low.
Again, the total room count doesn’t reflect the type of listings in the market, nor does it reflect the average room count year-round. The above figures are the total room counts in April 2021, which is off-season for the majority of North America.
Listings switch between active and inactive fairly recently, and these total room counts reflect that. Having a more in-depth view would only come once you were able to access year-round total room count figures, which only a select few dynamic pricing tools offer.
Insight Summary
These insights should offer Airbnb hosts based in British Columbia, Canada a greater view into the state of their current pricing, and how well their listing is coping within the greater domestic market.

